
![]()
![]()
![]()
![]()
Monitoring page of StanCam CCD #1Instructions and documentation Show STANCAM CCD1 database GainPlotted line corresponds to mean value X-axis tics are plotted every 10th day 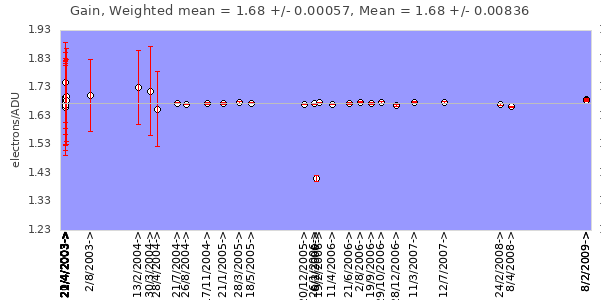 Read out noisePlotted line corresponds to mean value X-axis tics are plotted every 10th day 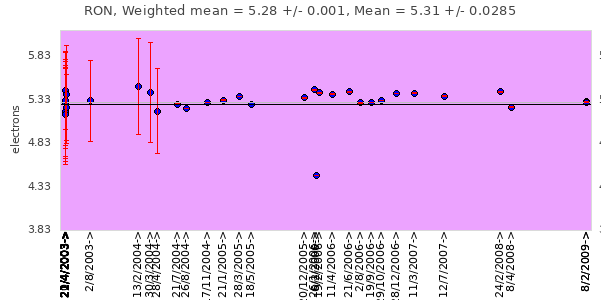 Difference in number of counts in flatfieldsPlotted line corresponds to mean value X-axis tics are plotted every 10th day 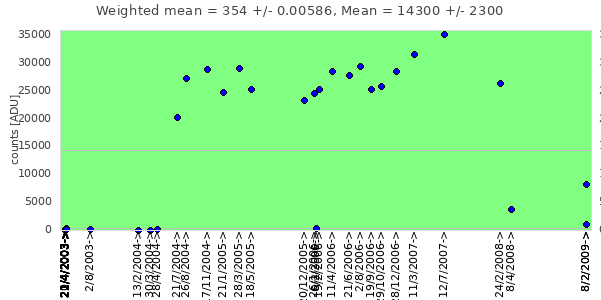 Bias levelPlotted line corresponds to mean value X-axis tics are plotted every 10th day 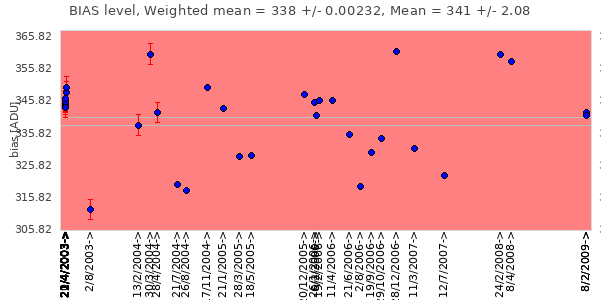 |
||
|