Some known CCD3-controller features
The data was taken using the ALFOSC
CCD14 detector.
- Structure in x-direction seen especially in bias (full) frames.
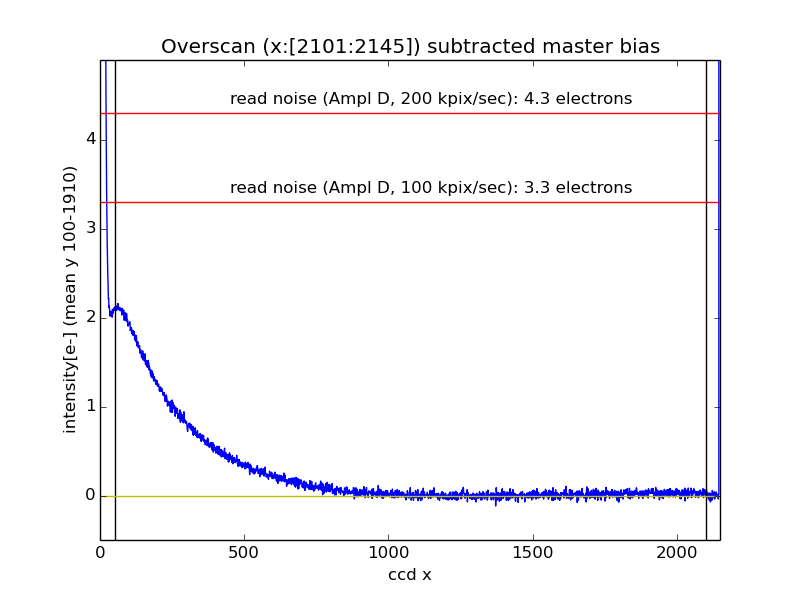
The average column of a combined master bias frame. The master bias was combined
from 11 frames using iraf/zerocombine. The vertical black line indicates
prescan and overscan region, red horizontal lines show the read noise
for a given read-out-speed and the yellow line (zero) is to guide eye.
Bias structure
The bias structure is slightly different if only a portion (in x-direction)
has been read out.
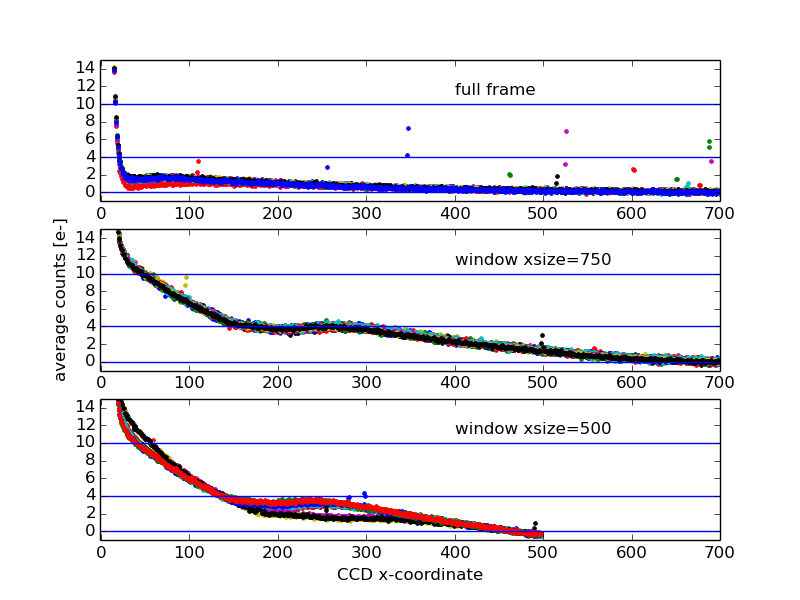
When reading only a window a few electron gradient is expected to be seen.
However the structure appears to be stable. The "full frame" plot shows 24 bias frames,
"window xsize=750" 14 and "window xsize=500" 17 frames (however see below about "window
xsize=500").
Window the first pixel in x
As shown above the "window xsize=500" appears to have variable
bias structure.
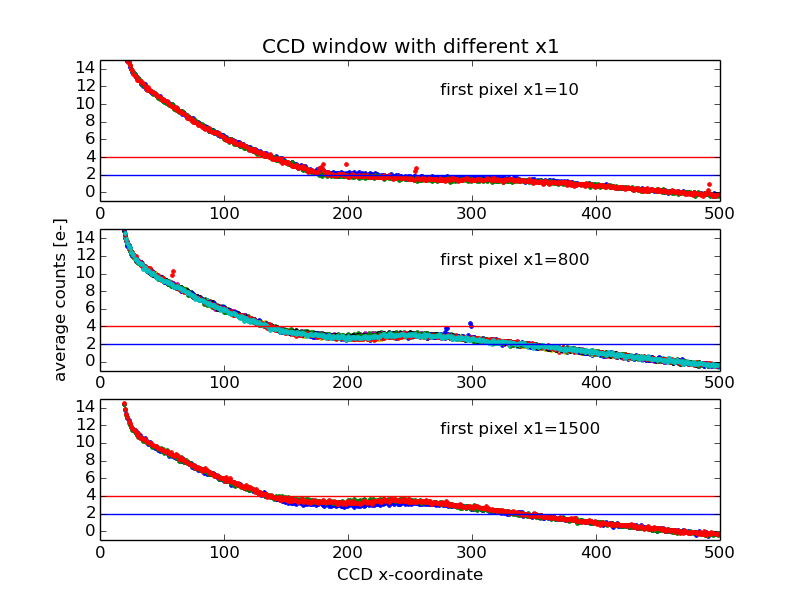
The above plot shows the bias profile when the position of the window
has been moved from left to right.
The profile in x-direction is almost identical when the first pixel
is either 800 or 1500, however for the x1=10 window the profile
is clearly different. This can be seen also from the "bias structure plot"
(above).
|